Let’s jump right in!
One of the traps beginner traders tend to fall in is solely basing their trading on technical analysis. Beginners often think if they learn everything about technical analysis that would be definitely enough for profitable trades.
Well, technical analysis by itself is useless, let us tell why.
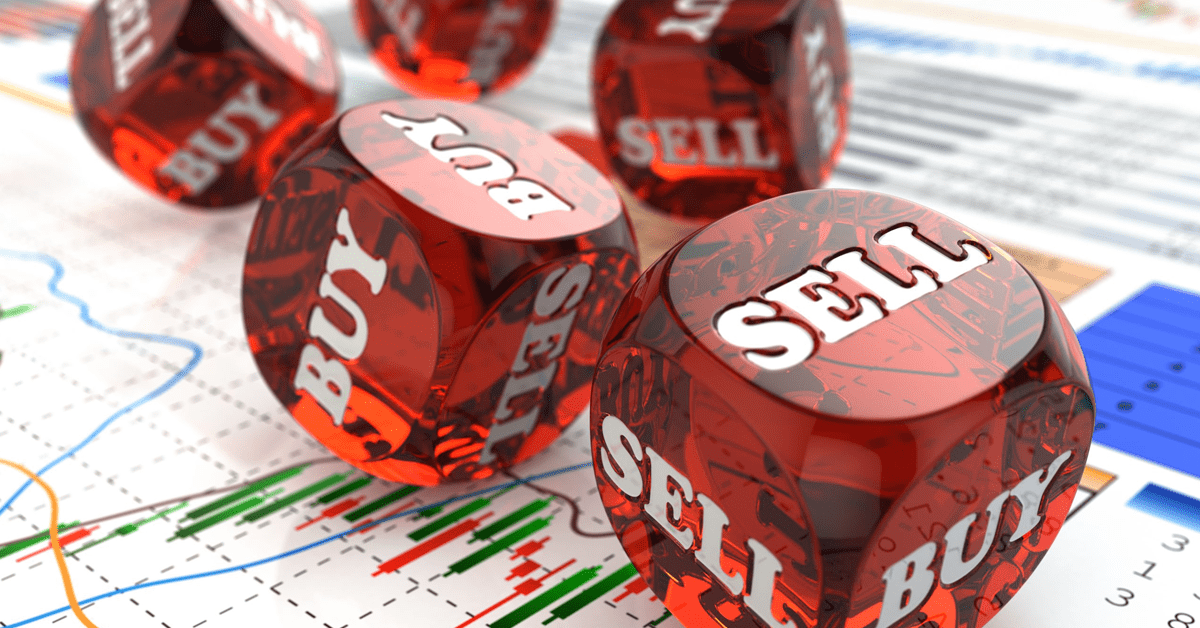
With technical analysis there are so many indicators, candlesticks patterns and so on that can give you a very convincing signal to buy or sell at the same time.
Let me give you an example of that, let’s take GBPCHF and I will show you two different but very convincing reasons, based on technical analysis, why you should buy it and sell it at the same time.
In other words, there are times when traders' technical analysis points to two different but very convincing outcomes, from the point of opening positions (short, long).

I
Here we have multiply tested the resistance and support area that was tested and broken a few times over the past few days. We also have two moving averages cross; MA20 is crossing from below MA150 which indicates that the price will move up. So we can go ahead and open long position.
II
At the same time RSI indicator, at that point, was showing overbought condition in the market and, we also have a downward trend, plus we have two red candles confirming the downtrend. So having that all in mind we could go ahead and entered short position
So, the question is how professional traders actually make money by using technical analysis?
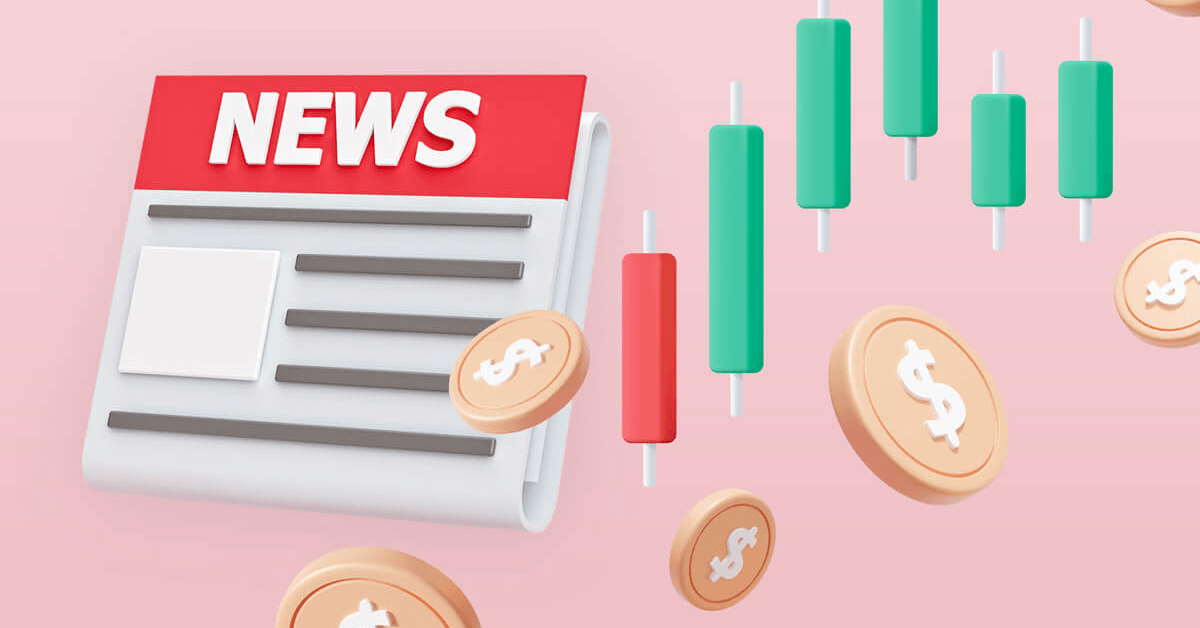
Well, you might think by combining fundamental analysis and news events, but, the answer is to combine certain selection of technical factors that have worked over time.
So instead of trading off random bits of technical analysis that constantly pointing out different things, we are suggesting trade on a system that we use every single time and that provides us with an edge over the market.
The answer is to create a rules based strategy!
Let’s take a look at rules based strategy
First indicator we are going to apply to our trading system is 50 EMA. What we want to see is the initial point where the price breaks above 50 EMA, once the price starts closing above the 50 EMA we will start looking for the other factors.
The Rules
- We want the price to close above 50 EMA.
- After the price breaks above the indicator, we wait for the pullback, at least 2 red candlesticks or more.
- One more rule is, the pullback candles should not cross the 50 EMA line
- Next we put a horizontal line on the body of our new swing high, as for the horizontal line we drew, we want to see our price after pulling back go up and cross it, when that happens that is our entry, break out candle need to be more than 2 pips above the horizontal line; to show that there is an actual potential breakout.
- Entry candle cannot be bigger than 1xATR (Average True Range)
Stop loss should be placed 1xATR above or below the entry candle, if the candle would be bigger it might lose its buying pressure.
Risk Reward ratio Rr/R - 1.4/1
Let’s test it on real life Bearish example
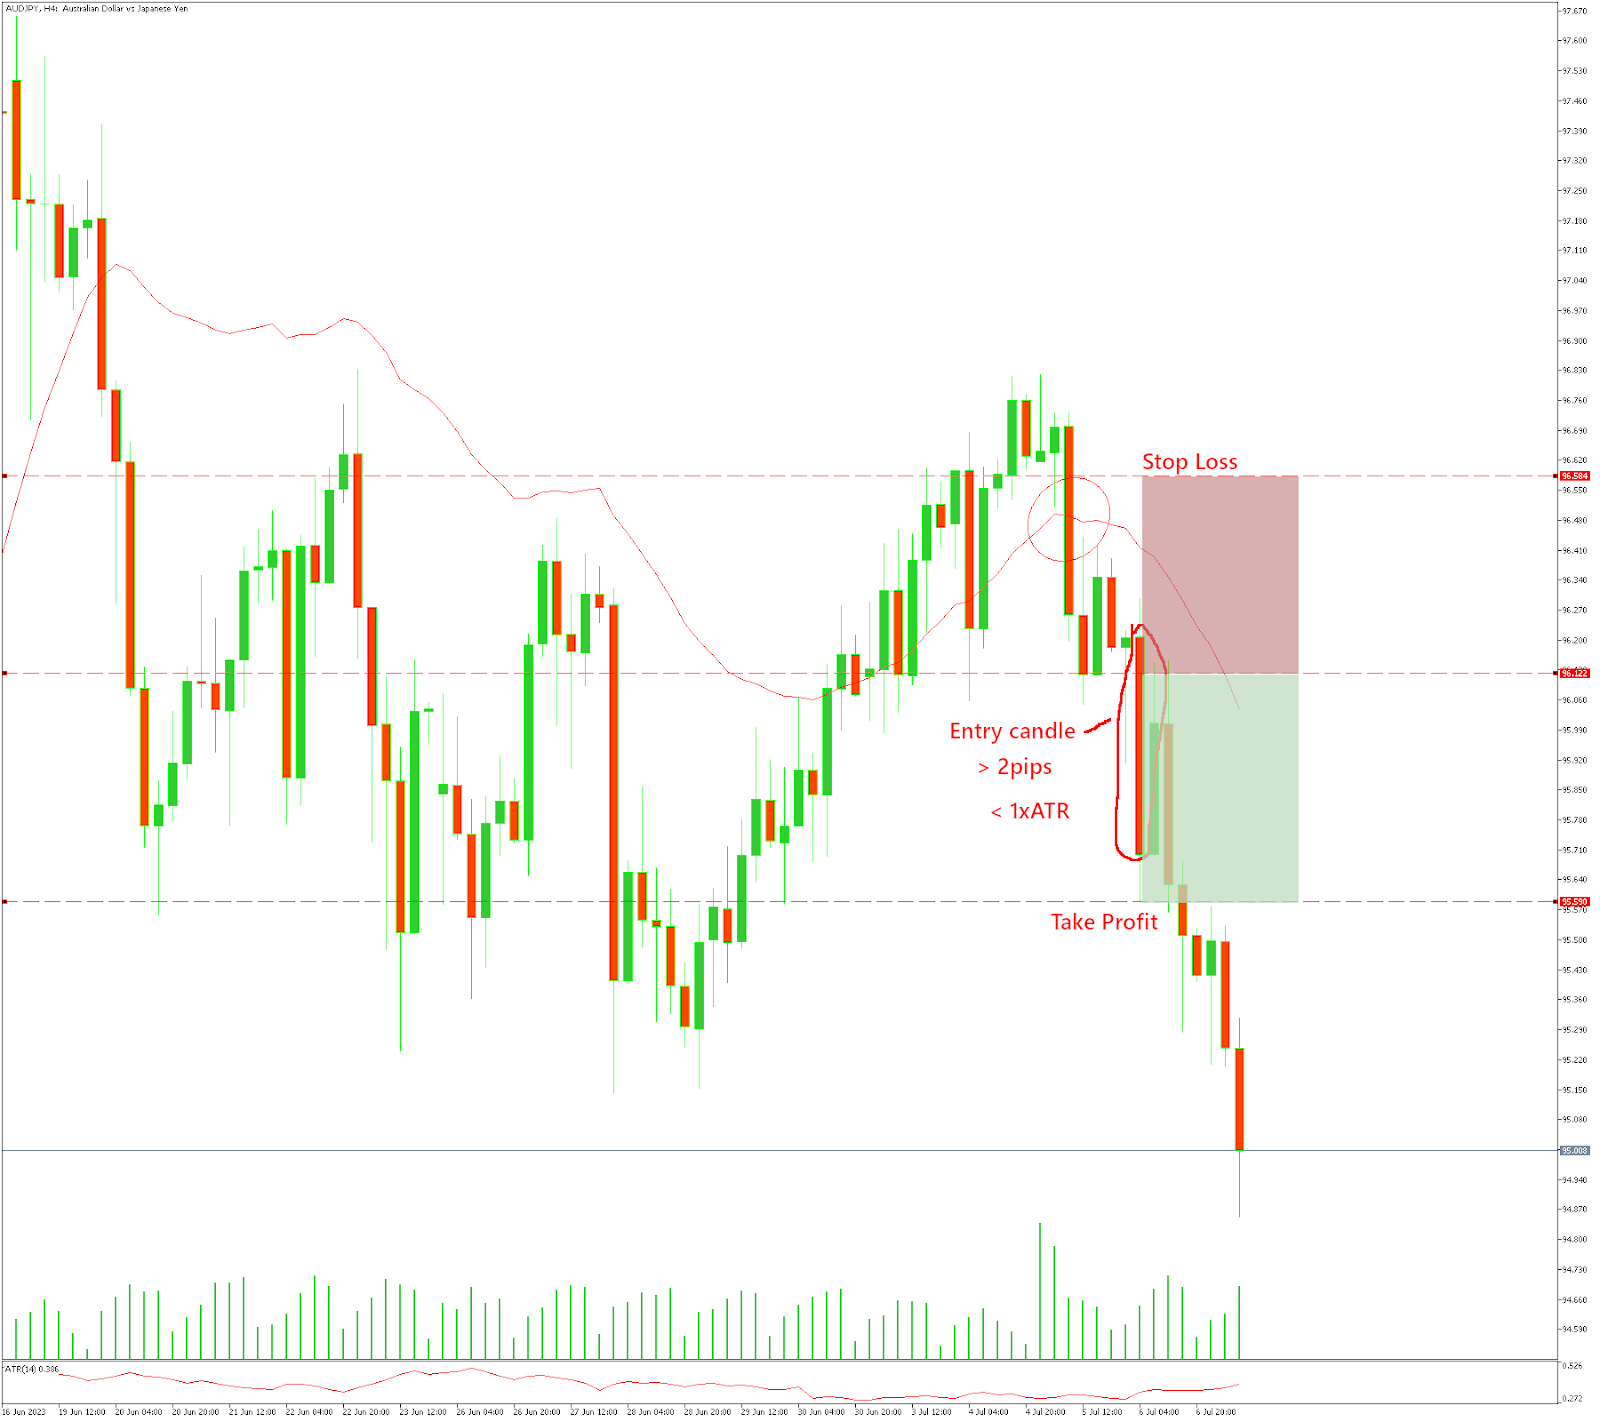
Here is an example of a really simple rules-based strategy that has combined technical factors. This is the secret, technical analysis alone is never going to make you a profitable trader, you are going to have to make different parts of technical analysis and combine them into a trading strategy.
As you can see this trading strategy is not more than combination of different technical factors, in this case we were using a moving average, and a break of that moving average that will signify potential price reversal, then we are waiting for a pullback, in order to make sure we have selling pressure before the breakout for a possible entry.
So, go ahead try this strategy, multiple times backtest it, see if it works for you. Good Luck!