
You`re considering trading GBPUSD currency pair. And to decide whether to go long or short you will need to use technical analysis and more
Step 1: Review the Price Chart
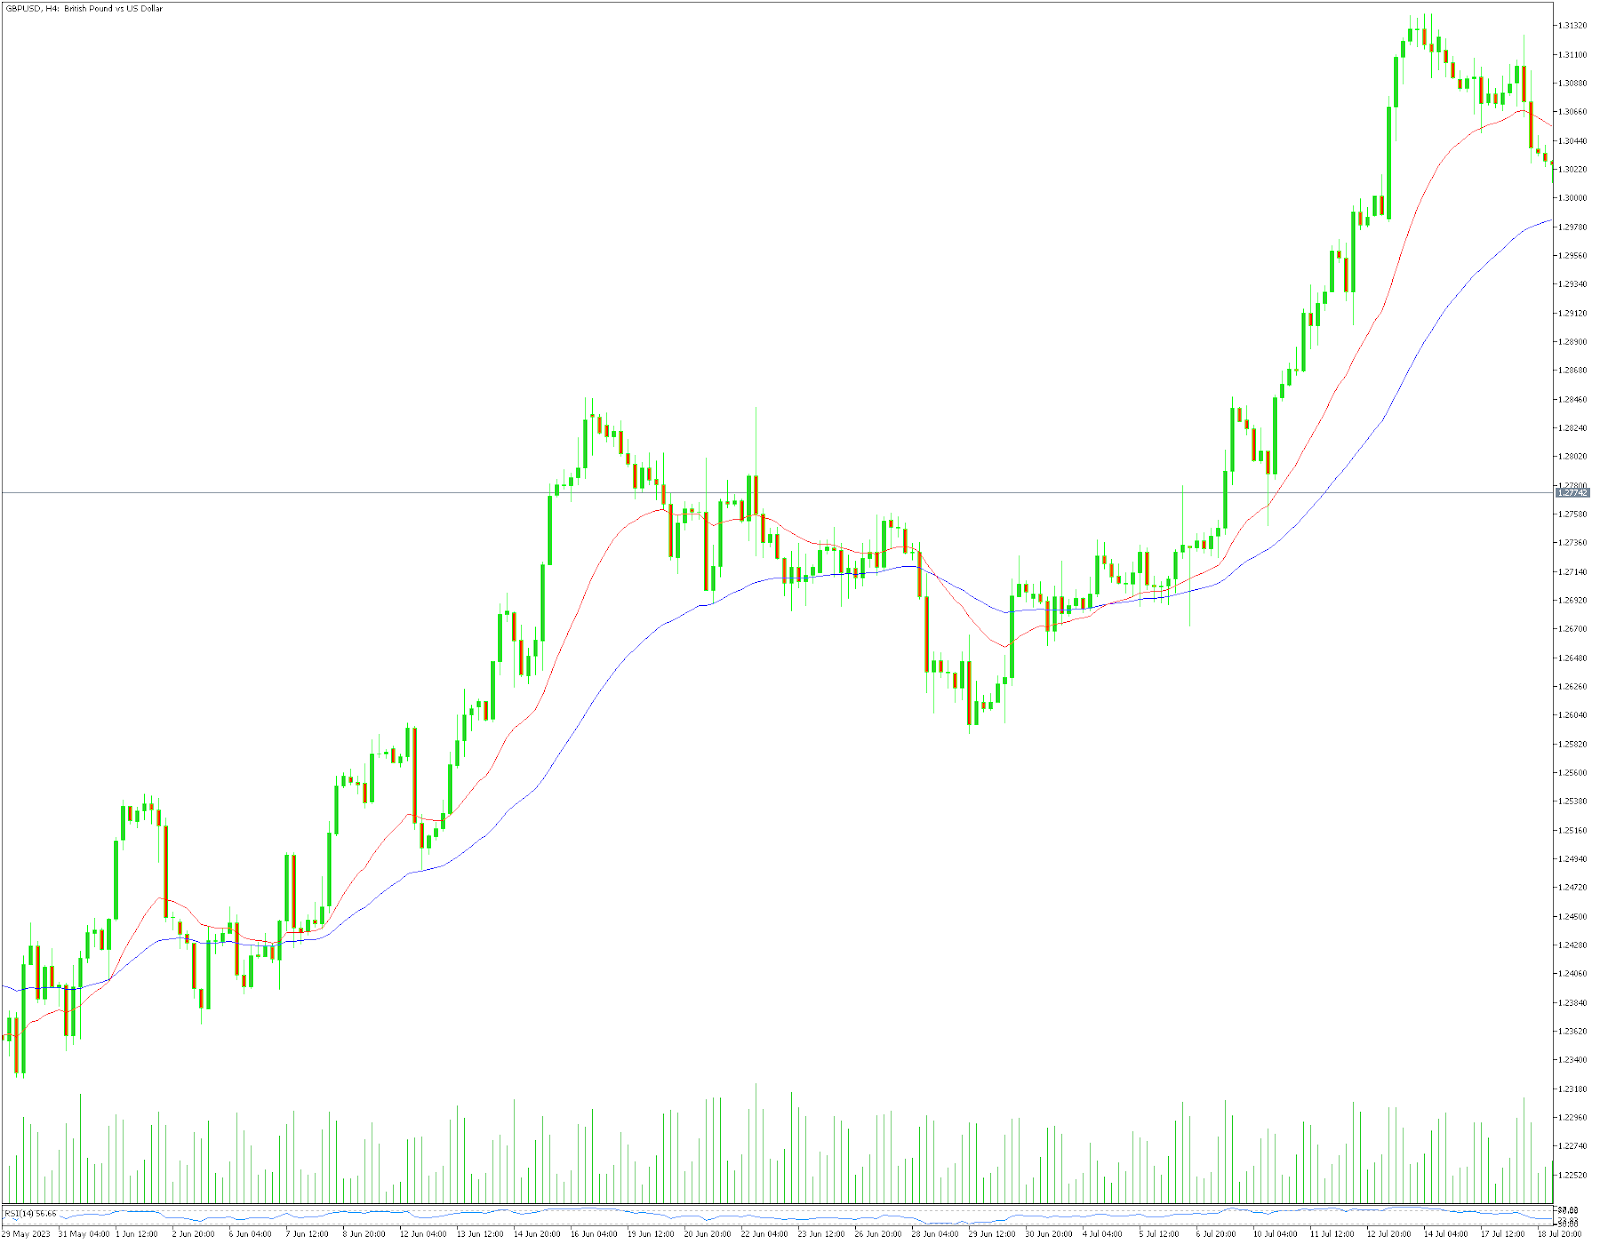
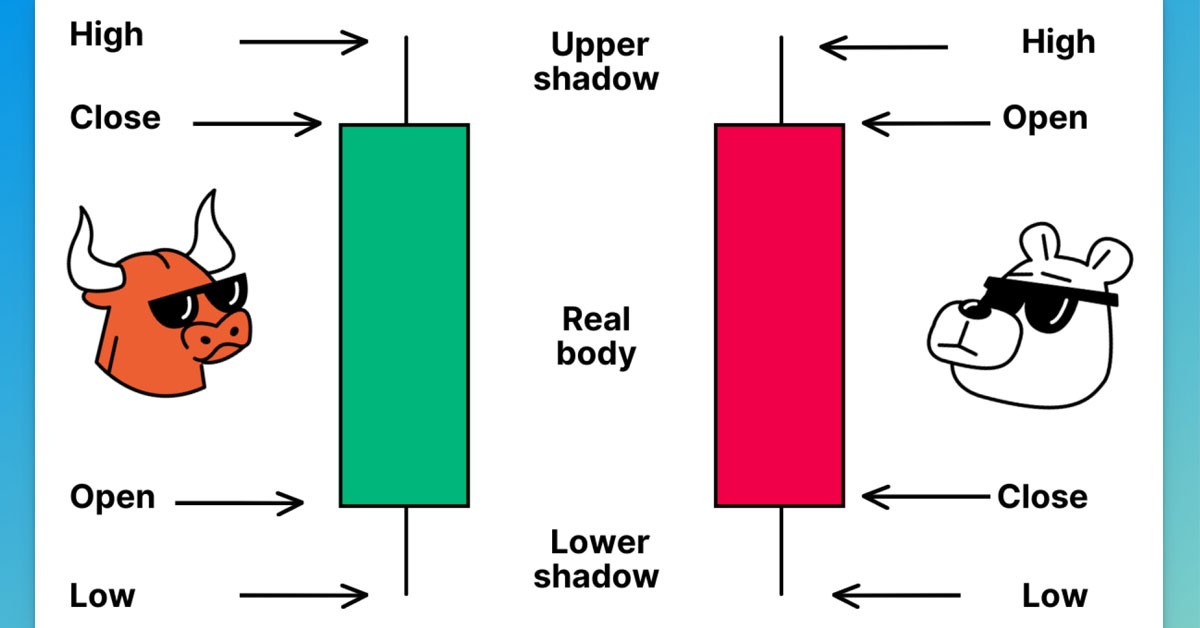
You start by looking at a candlestick chart of GBPUSD currency pair over the past few months.
Step 2: Identify Trends and Support/Resistance Levels
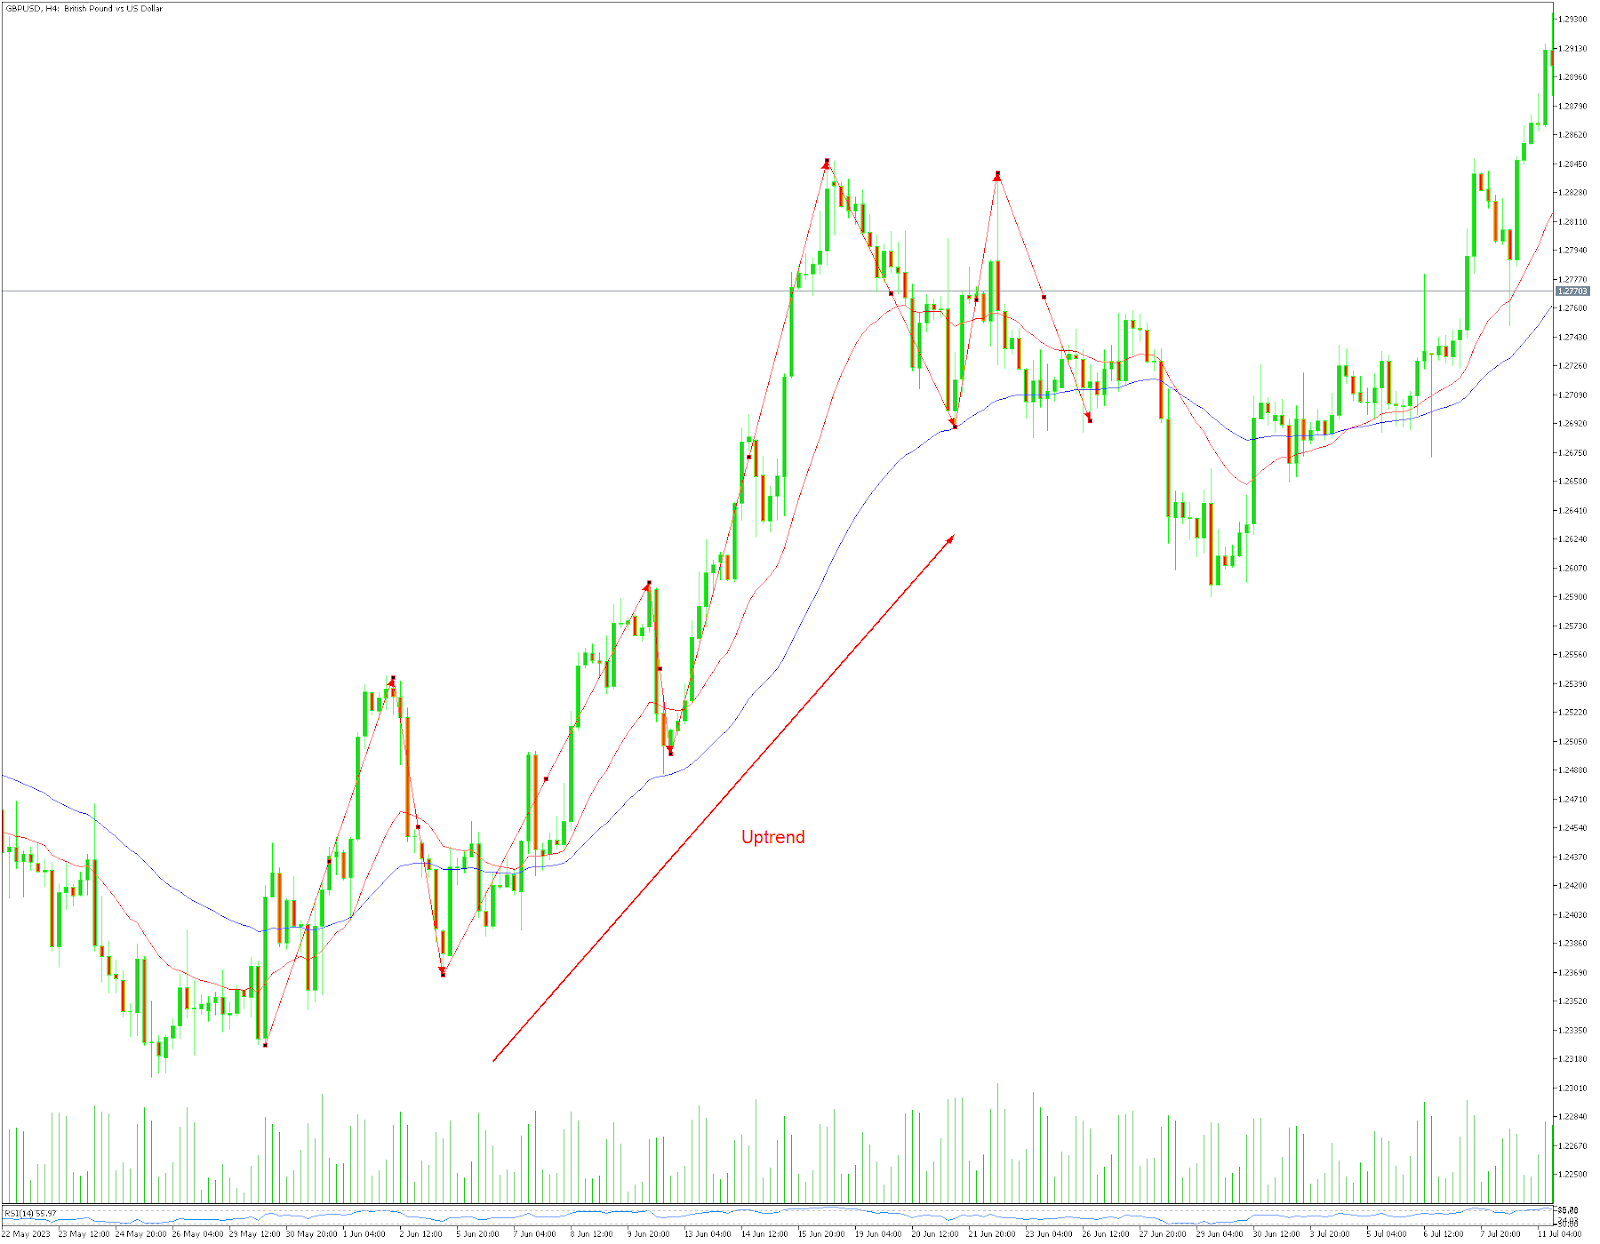
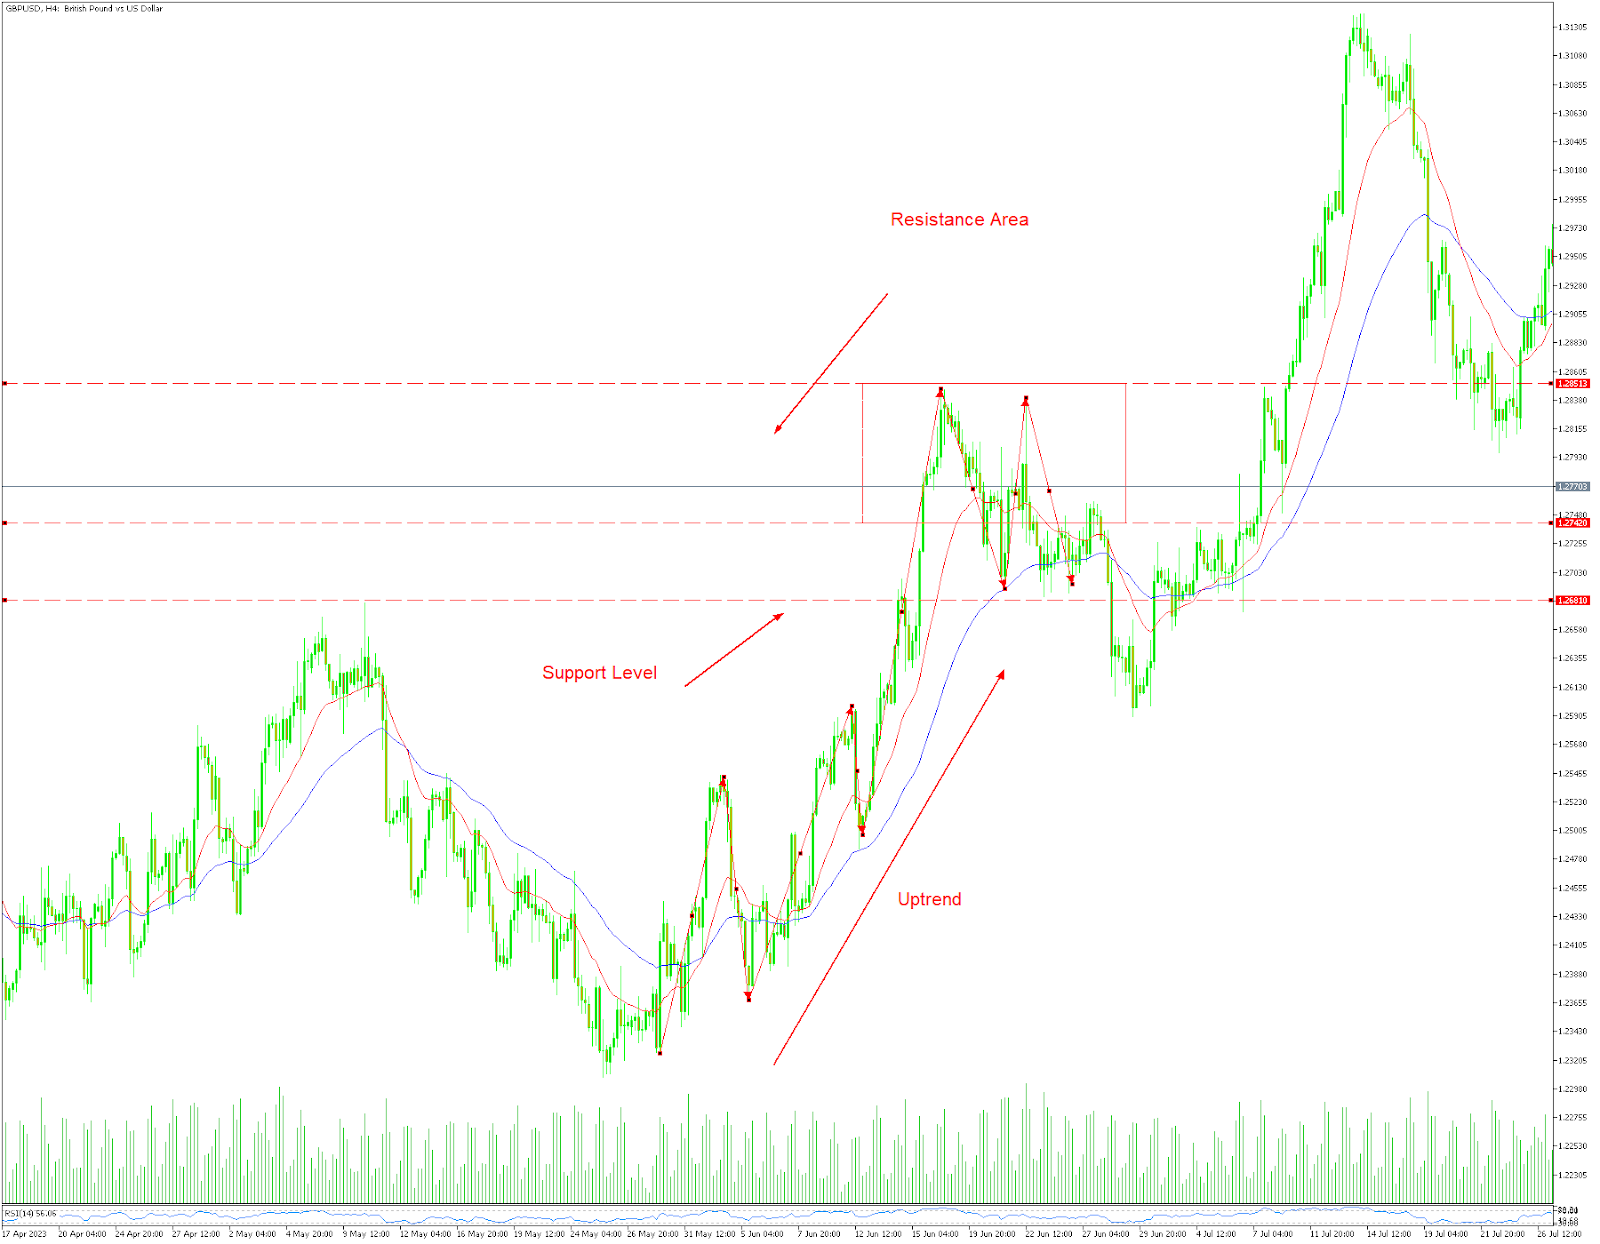
Upon analyzing the chart, you notice that the stock price has been steadily increasing since May. You identify a clear upward trend marked by higher highs and higher lows.
You also notice that there seems to be a strong resistance level around $1.27420 and 1.2851, where the price has struggled to break through in the recent past. On the other hand, the stock seems to find support around $1.26810, where it tends to bounce back from.
Step 3: Use Moving Averages
To get a clearer picture of the trend, you decide to overlay a 50 and 20 - day EMA on the chart.
The 20-day EMA is above the 50-day EMA which confirms the upward trend, which is a positive sign for the bullish trend.
Step 4: Apply an Indicator
You decide to use the Relative Strength Index (RSI) as an indicator to gauge whether the stock might be overbought or oversold. RSI Indicator The RSI is currently around 70, indicating that the stock might be overbought. This suggests that the stock could potentially experience a pullback or correction in the near future.
Step 5: Monitor for Patterns
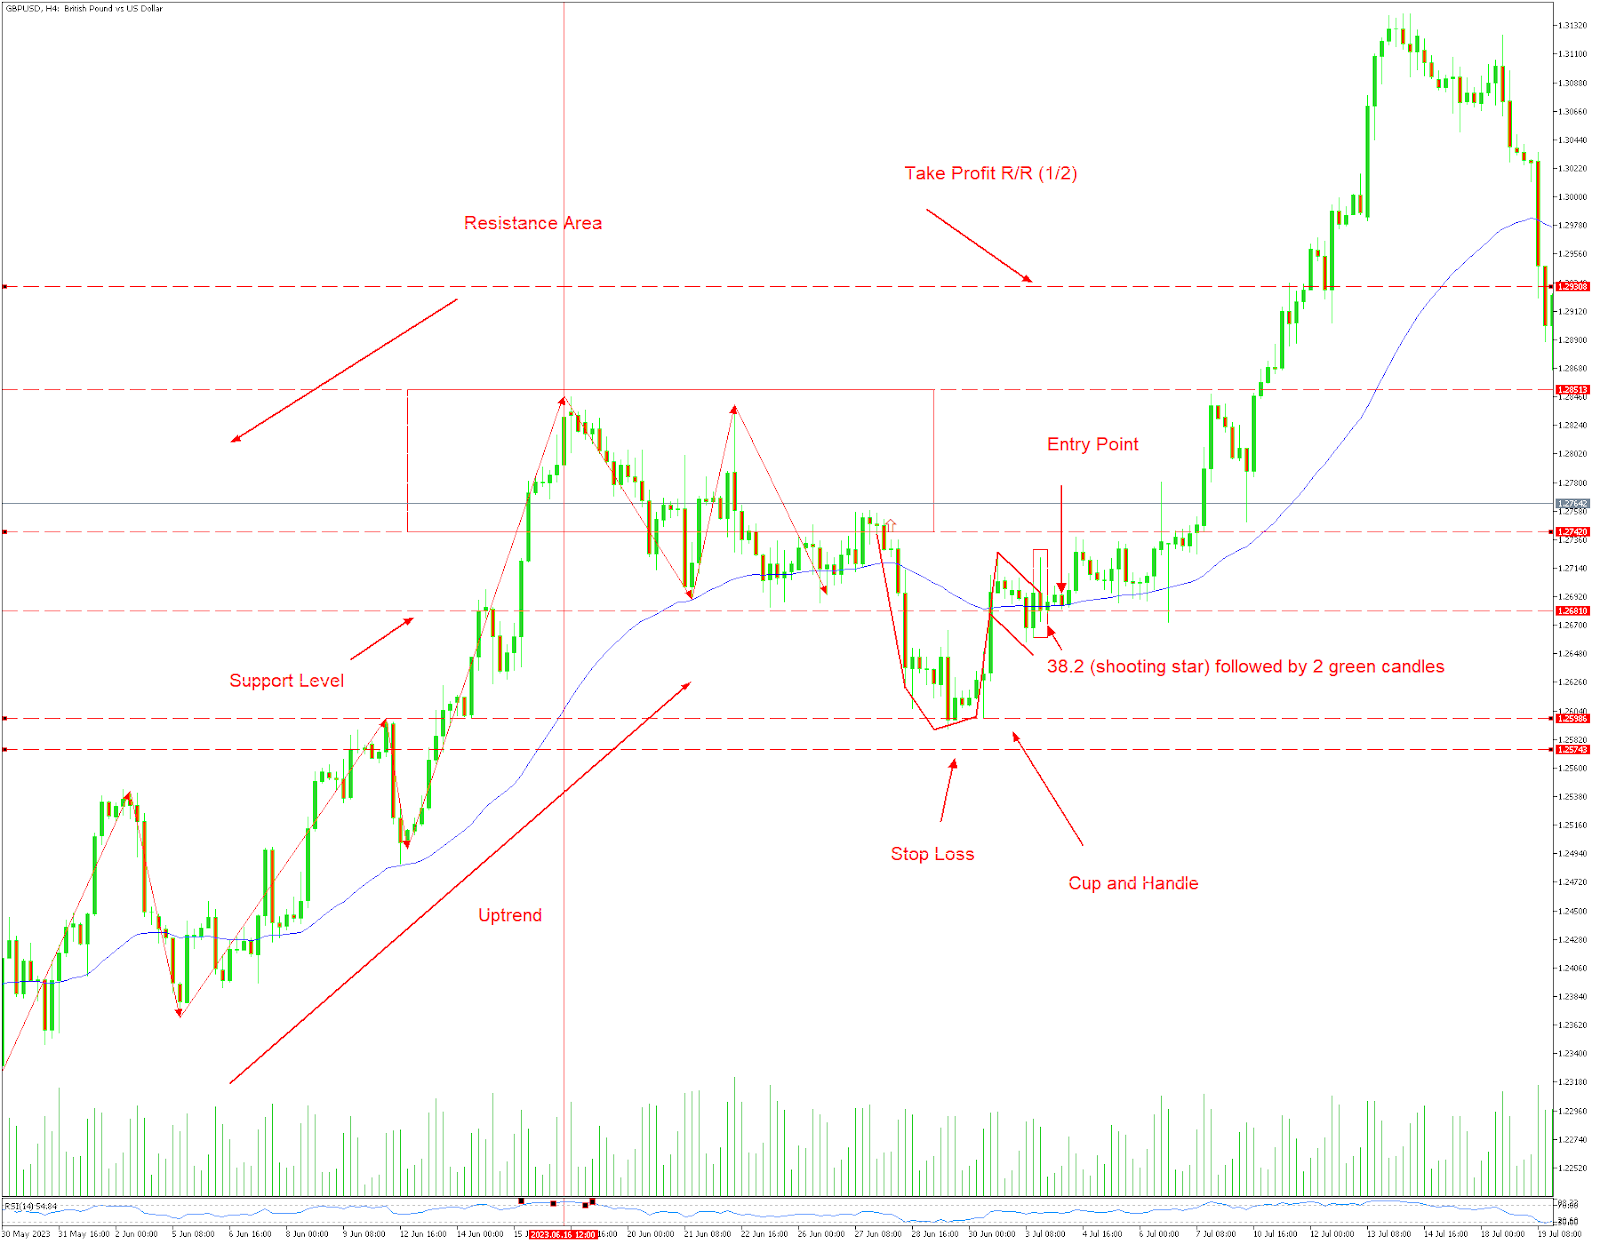
As you continue your analysis, you notice that the stock seems to have formed a "cup and handle" pattern, which is often considered a bullish continuation pattern. Cup and Handle Pattern This pattern suggests that the stock might experience a breakout to the upside, potentially reaching higher levels.
Here are some tips for trading the cup and handle pattern:
Use the "Cup and Handle" indicator to identify potential cup and handle patterns on your charts.
Look for cups that have a rounded bottom and relatively equal highs on either side.
Avoid cups that have a sharp bottom or that are very deep.
Look for handles that are relatively short and shallow.
Avoid handles that break below the bottom of the cup.
Wait for the price to breakout of the handle formation before entering a trade.
Set your stop loss below the bottom of the cup.
Take profits when the price reaches your target or when the pattern breaks down.
Conclusion:
Based on your technical analysis, you observe the following:
The stock is in a clear upward trend.
It has encountered resistance around $50 and support around $40.
The 20 and 50-day EMA confirms the bullish trend.
The RSI suggests the stock could be overbought, hinting at a potential pullback.
The cup and handle pattern indicates a potential continuation of the bullish trend.
If your answer was
Yes, I would open a long position, then
Yes, you were right!
Now that you have learned one more trading strategy, go ahead and try it out on real account


Очень интересно , здесь необходимо время , я пенсионер и времени на это не хватает , но интересно.