
Candlesticks and candlesticks patterns are the most important thing you will need to understand when trading. Without understanding candlesticks you can’t read prices much less make accurate trading decisions about what’s going to happen next. So having a clear understanding of candlesticks and candlestick patterns is what you need for the foundation to build a profitable trading career.
In this article we will show you how to read candlesticks, so let’s get started.
How To Read Candlesticks
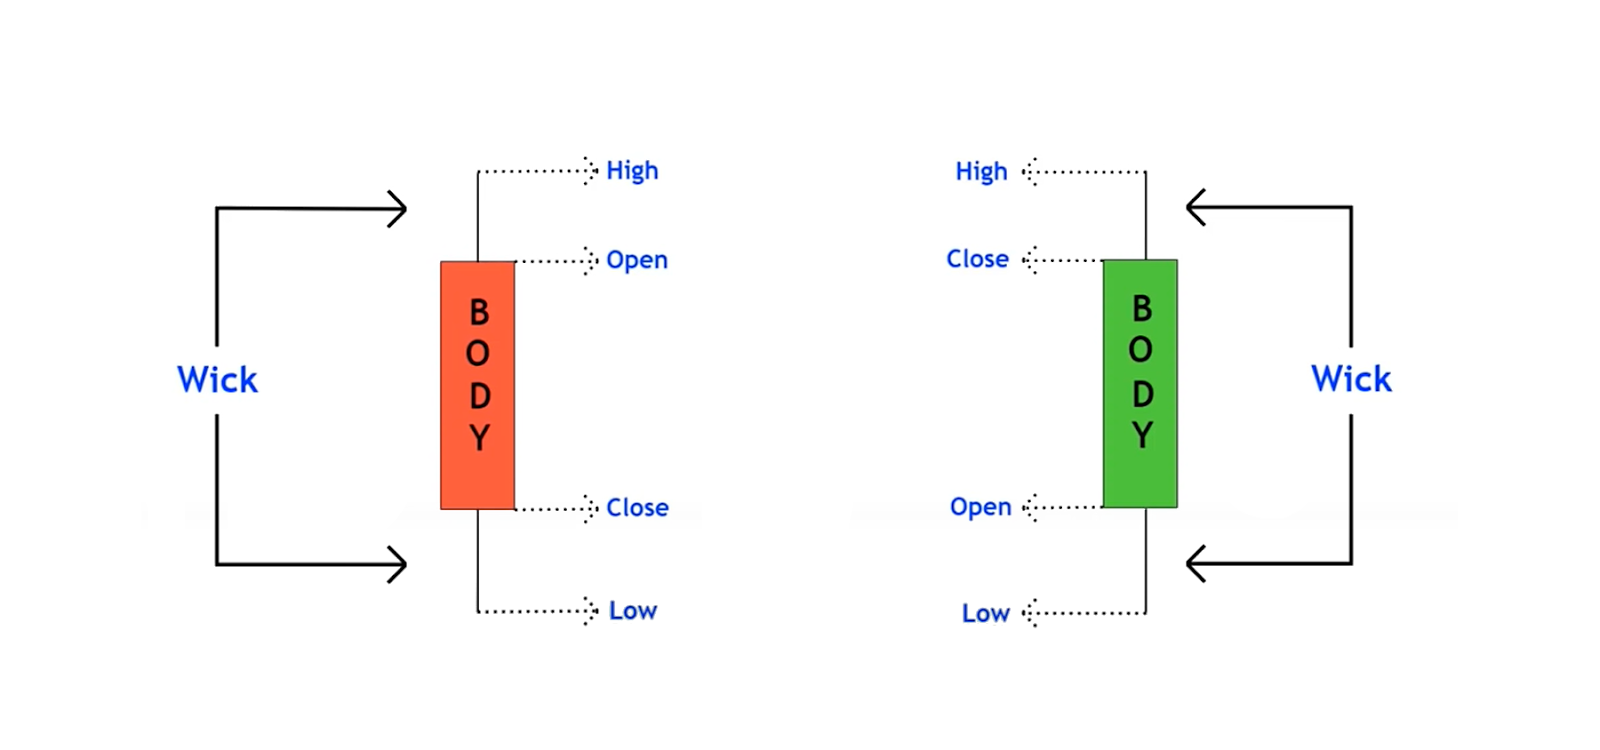
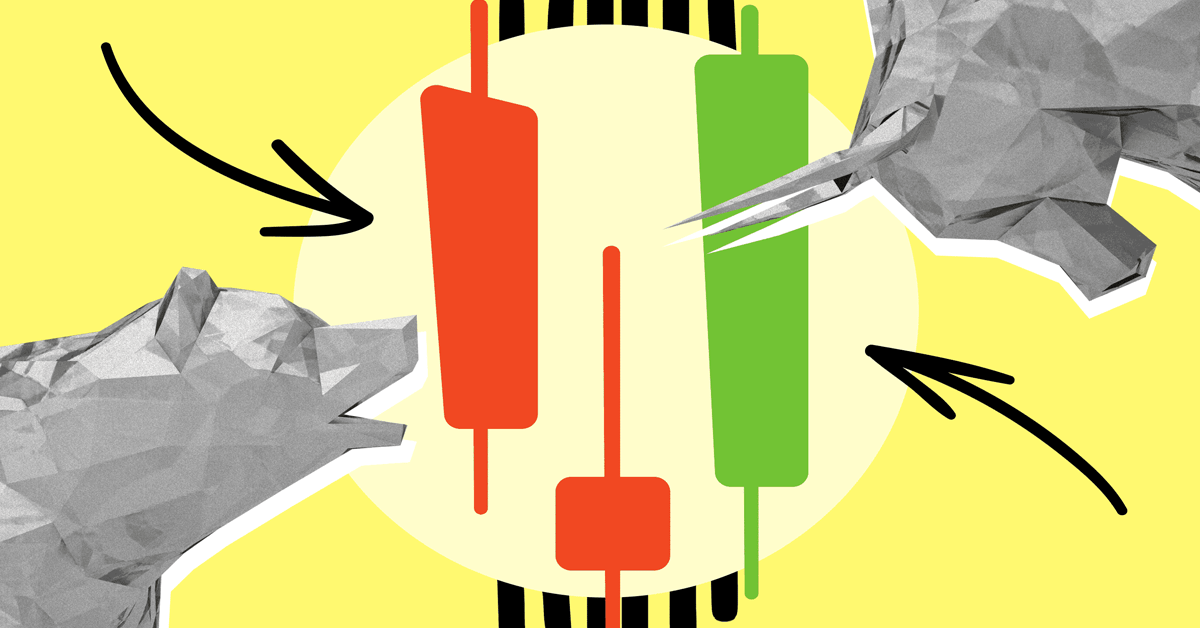
Here we have two candlesticks, so what they represent is the price movement throughout the time period depending on the time frame we are on (daily chart, 1 Hour, 4 Hour etc.). Let’s consider that we are on a 4 Hour chart, that means that each of these sticks will represent a 4 hour price movement. As you can see from the image, candlesticks have two parts body and wick, a green candlestick’s body represents a 4 hour price movement where price closed above where it opened, and vice versa for the red candlestick. Now wick represents the highest and the lowest points price got during 4 hours.
At any other time frame everything is exactly the same, except for the amount of time passes.
Now that you know what candlestick represents, let’s try to understand the psychology behind the candles and what the size of the wicks and the bodies can tell us about the potential direction of a particular asset.
Let’s start with 4 hour chart of USDSGD (US Dollar/Singapore Dollar)
We have a green candle with a no wick below and a teeny tiny one above the candle, what that means is that the buyers were in control for over 4 hours, and the price closed above the price it opened.
We are going to talk about three different candlesticks psychology wise
- Momentum candle
- Long wicked candle
- Indecision candle
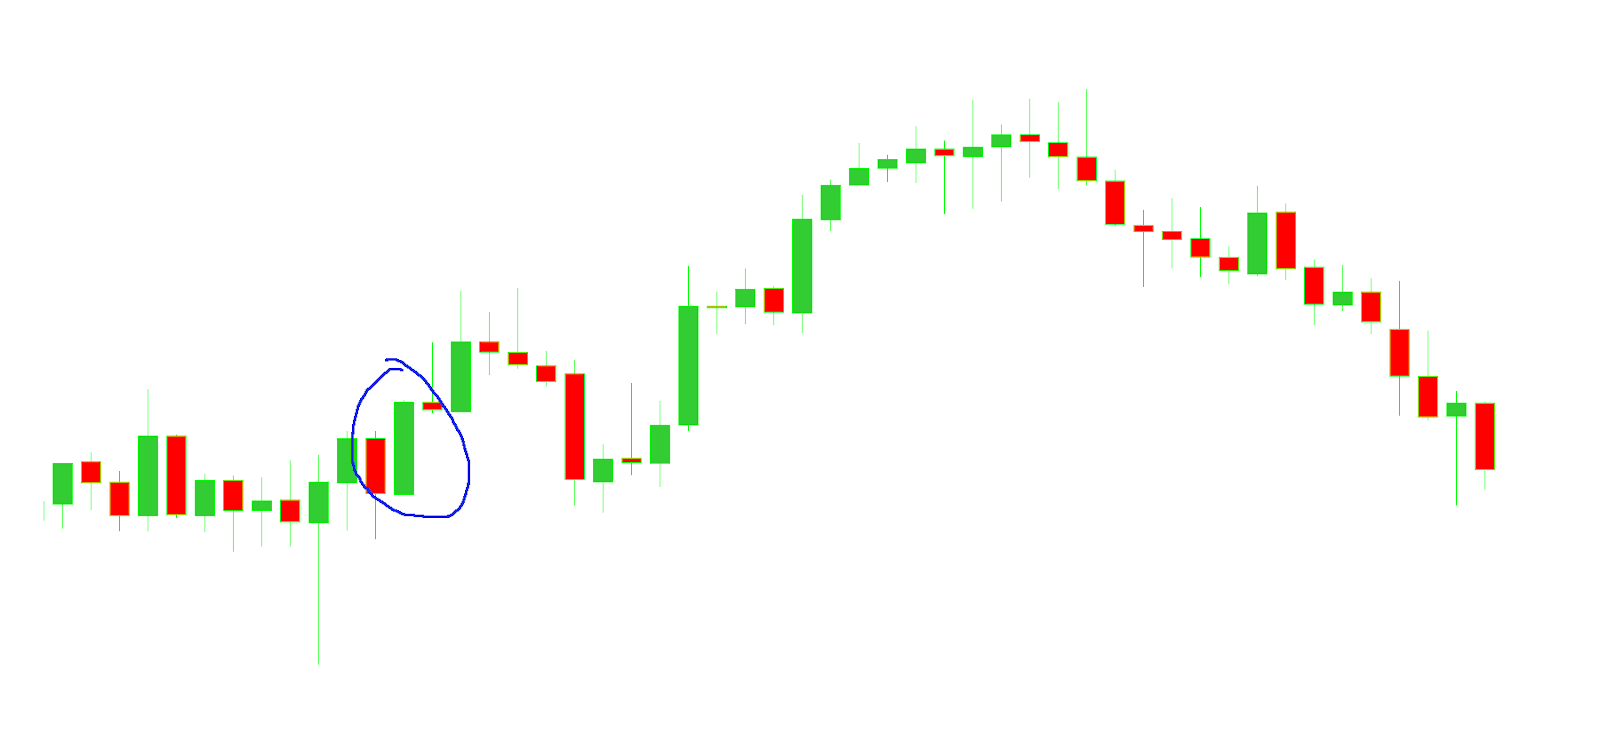
Momentum Candle
How to understand if the candle has momentum?
Well it depends on how long is the body of the candle compared to wicks. On our above green candle (bull bar) example, we can see that the price within 4 hours didn’t swing low or high much, meaning the buyers were stronger than sellers and the price went up and closed. And that may indicate that buyers (bulls) may end up being in control over another time period:
But, of course, it’s not a 100% rule.
Note: all the candles we’ve disgusted have psychological weight only when they are located on swing high or swing low, or at the end of the pullback.
Let’s take a look at a bearish momentum candle
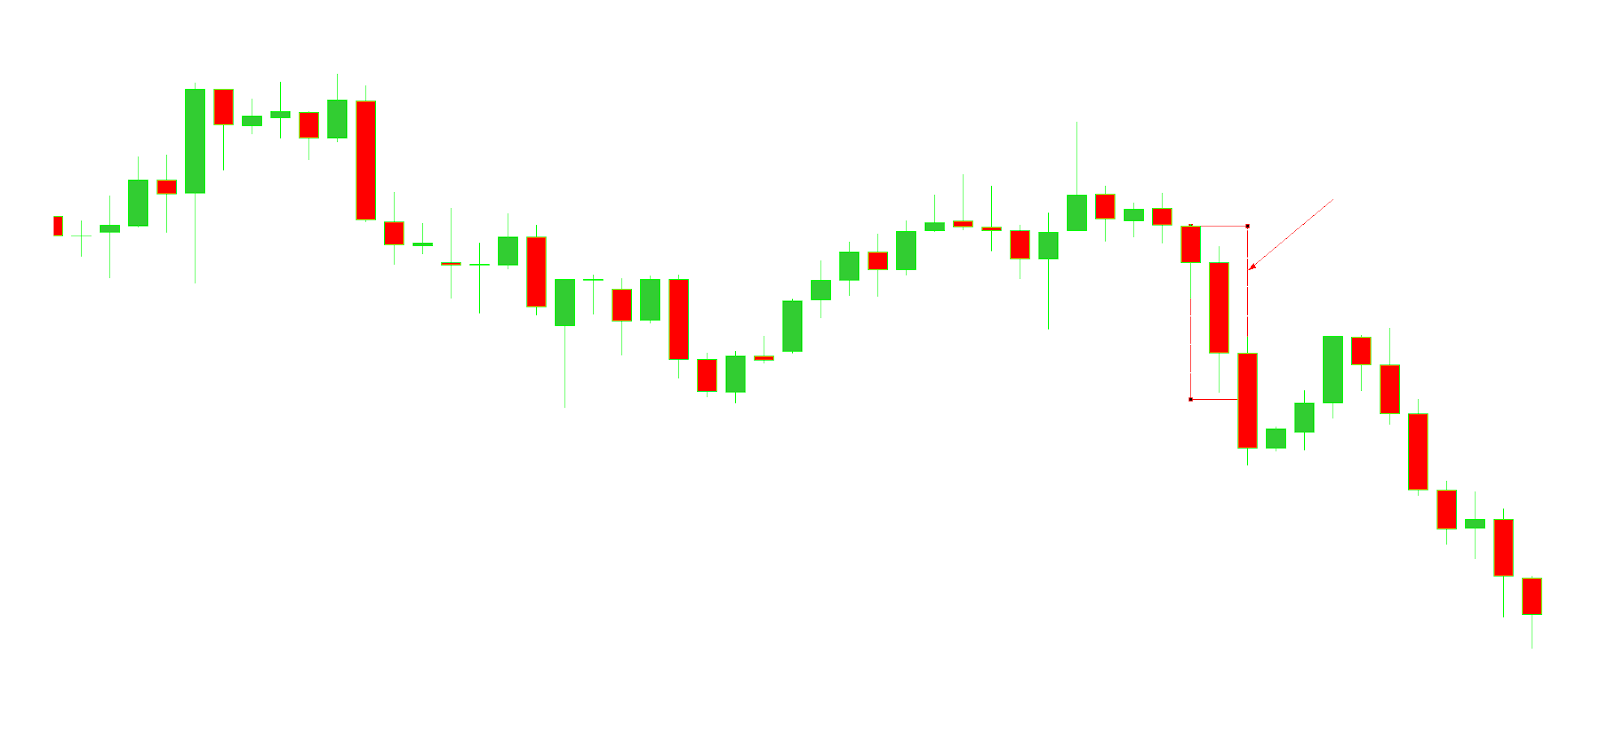
Price opened up, the bulles pushed a bit price up, but bears momentum were much stronger during 4 hours and price closed near the low of the candle.
You should be looking at candles as a battle between buyers and sellers of the market, this way you will better understand the force of the candle.
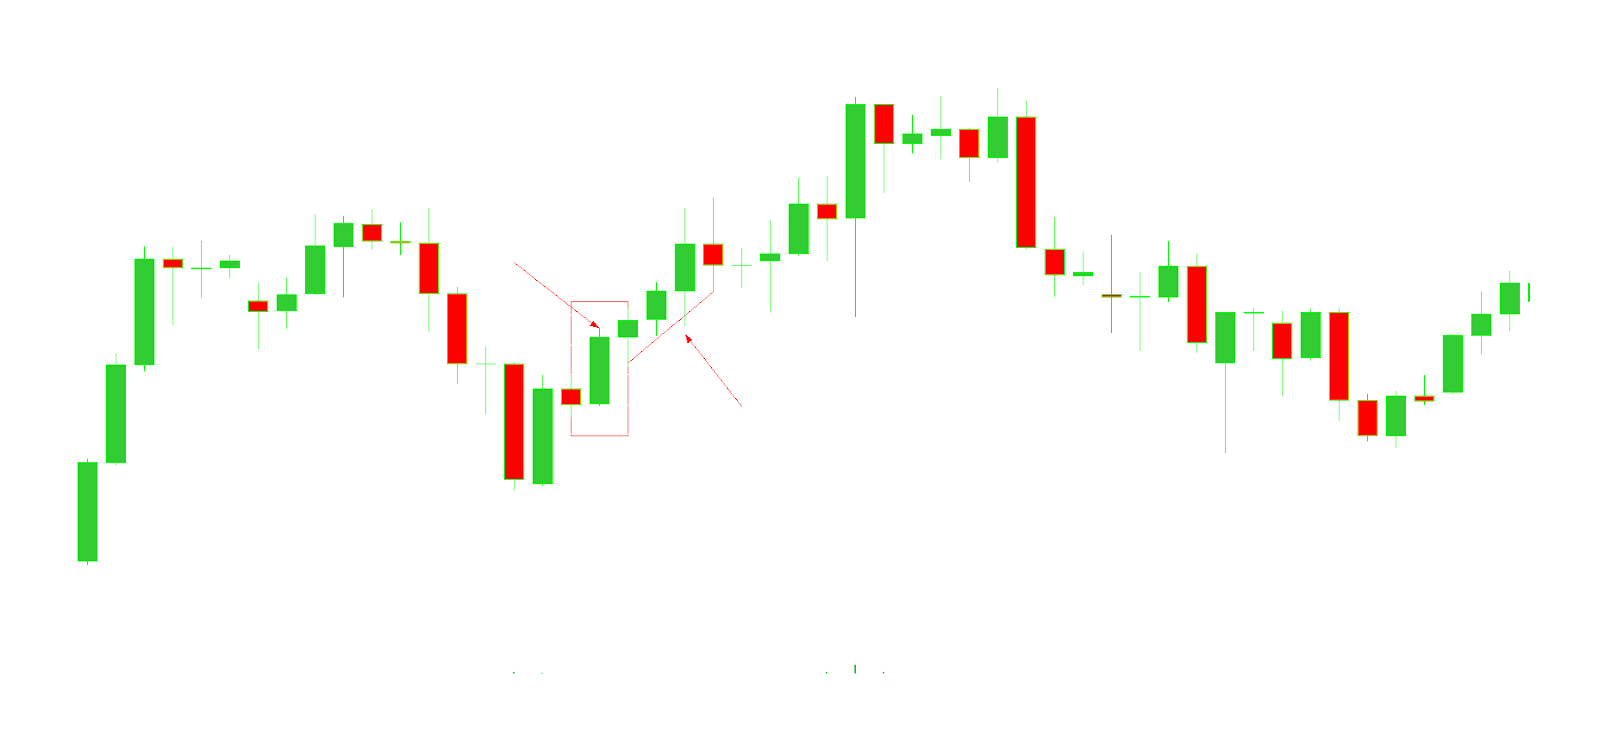
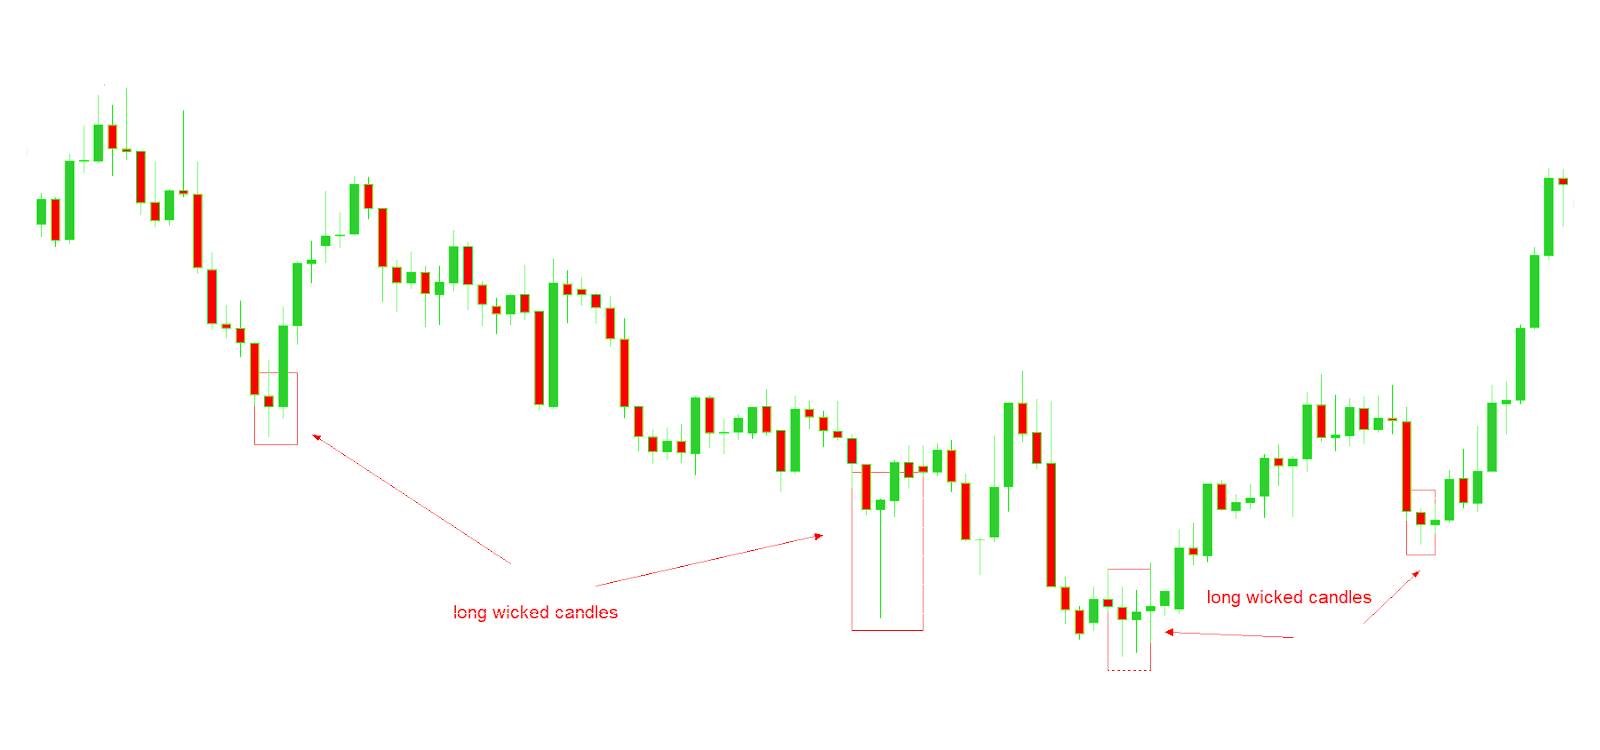
Long wicked candle
Now let’s look at a long wicked candle example. This type of candle is very straightforward and very easy to understand. Here we have a situation where price opened bears (sellers) took control and pulled down, but then bulls (buyers) took control back over and pushed the price up and ended up closing the price close to the high. 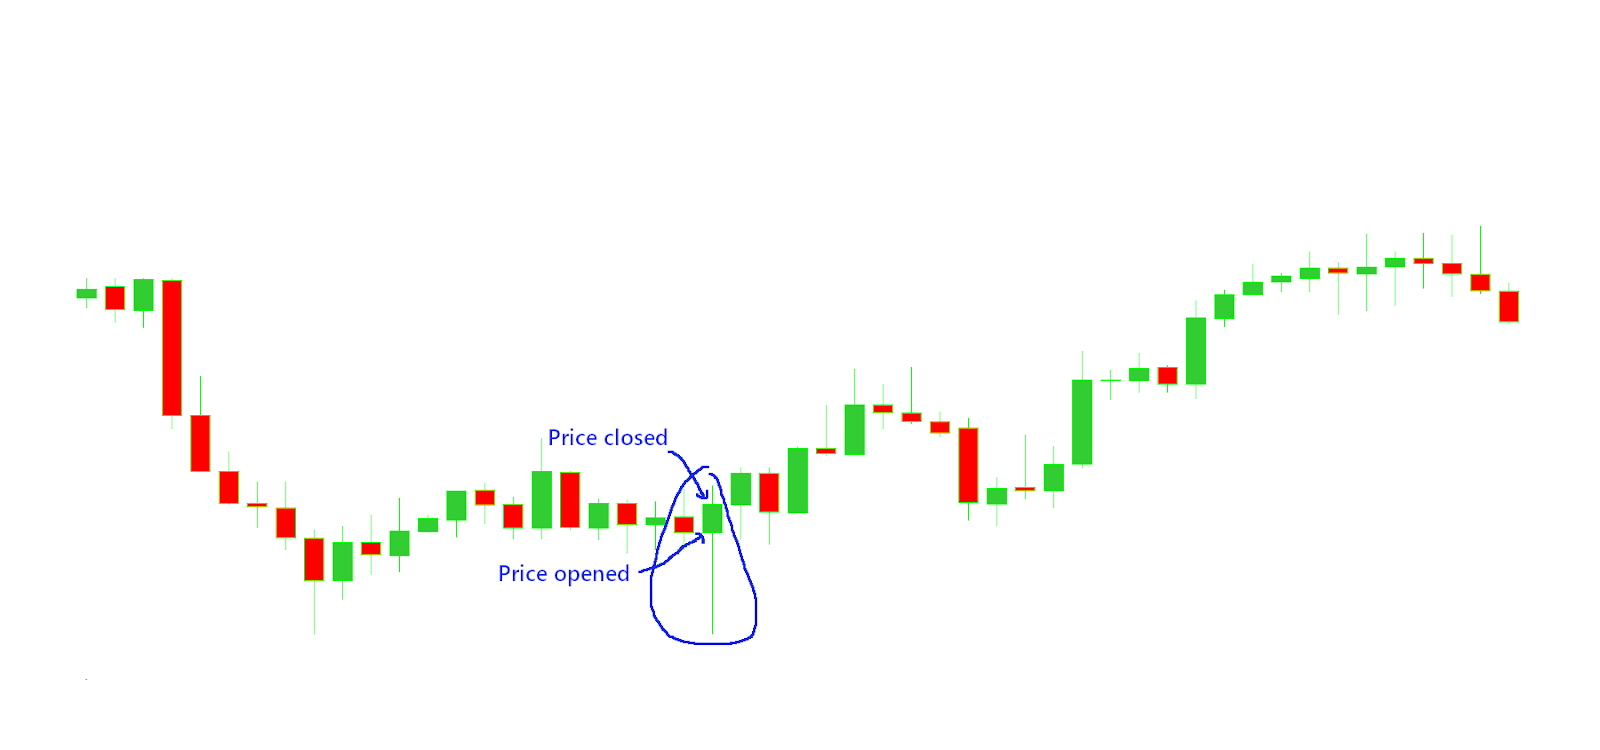
Here you need to understand and remember that this type of candles if located in the swing low or at the end of pullback are a bullish signal.
Indecision candle
Here we have indecision candle it’s called doji, check out the image below
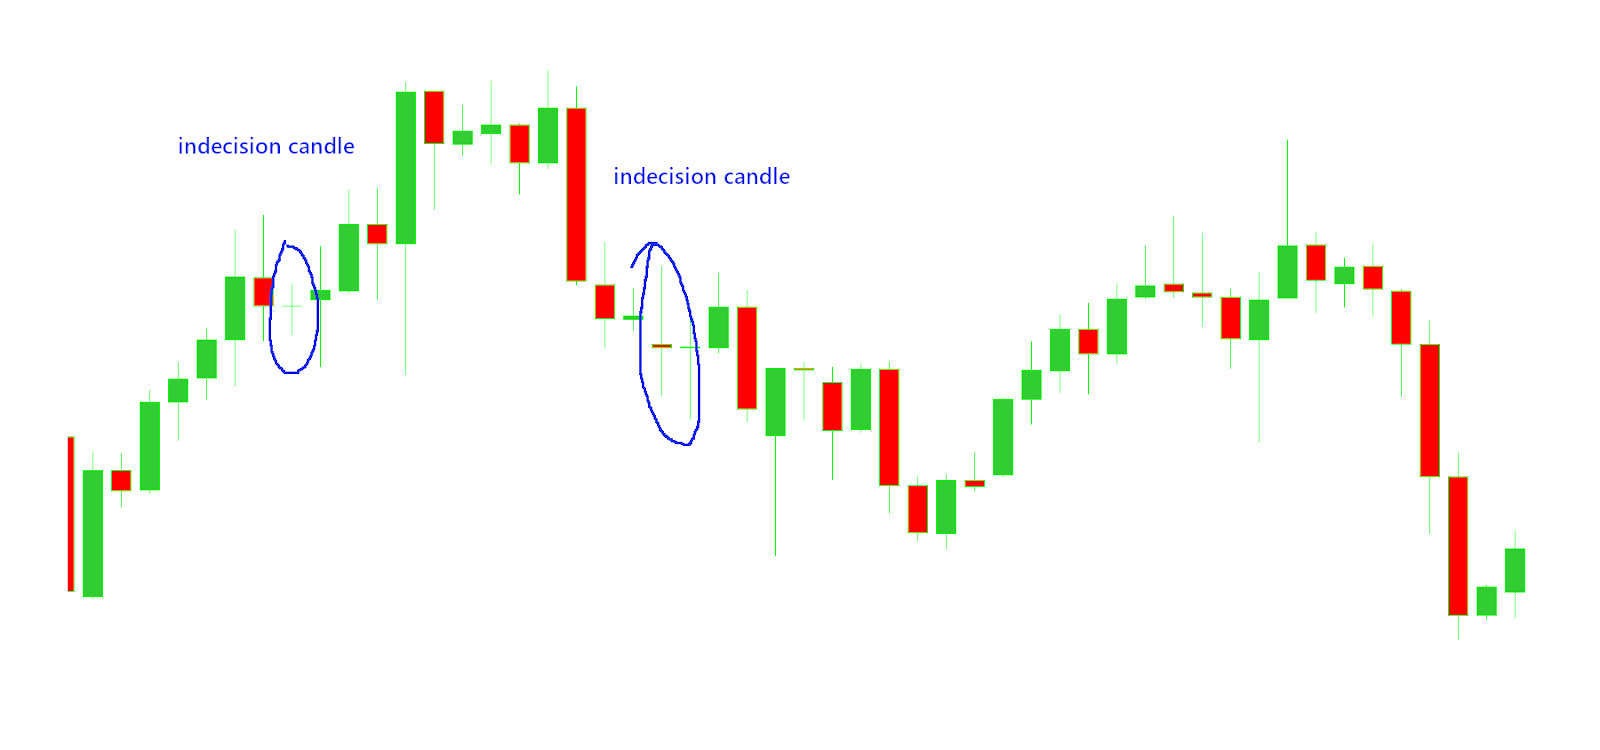
What these look like is that no matter the size of the wick, they have similar wicks to the top and to the bottom with a small body. So how can we interpret this candle, we have the same amount of pressure coming from bulls (buyers) and bears (sellers) and the price, despite swinging up and down, closing nearly the same place where it opened. With indecision candles we don’t have any bullish or bearish momentum coming in the market if anything they represent indecision.
So that’s the psychology behind candlestick and how we can use wicks and bodies to help us determine what the next move of the price may be.
Go ahead, start practicing to read candlesticks patterns using what you have learned today. Good Luck!


سلام از شماوپشتیبانی تشکر میکنم که زحمت کشیده واموزشهایی میگذارید تا بتوانیم معاملات بهتری انجام بدیم مرسی از زحماتتون