Foreign Currency Exchange market or Forex is one of the fastest growing and dynamic financial markets in the world. Despite the fact that it may seem trading currency pairs is simple, it is not like that. Effective Forex trading requires traders not only to analyze the received information and make predictions, based on their knowledge and flair, but also to use technical analysis tools – a large number of indicators and graphical objects, which are going to be discussed below.
Forex charts display the dynamics of prices of various currency pairs based on historical data. In fact, the market participants use the data of charts for deciding when to open or close positions. Charts are an optimal instrument for analyzing trends and patterns. For traders understanding charts it is not difficult to predict the direction of the market. Two schemes of chart analysis may be noted: graphical objects and indicators.
Forex Chart Types
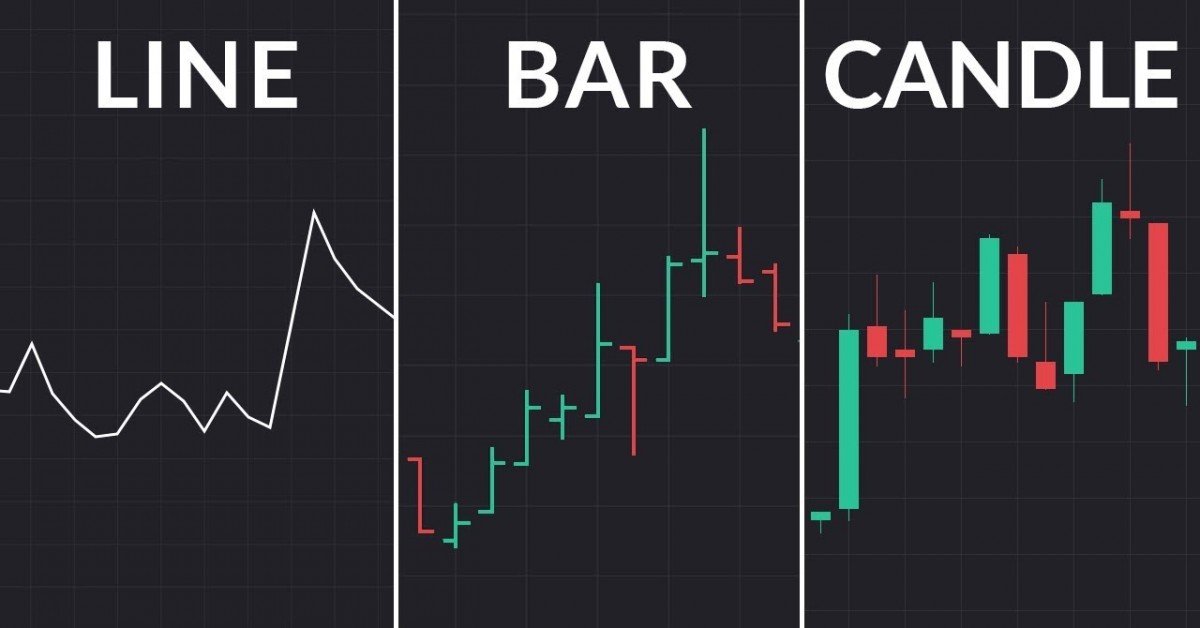
Each type of Forex chart has specific features and advantages. There are different types of charts. However, there are three most commonly used and well-known Forex charts among traders and analysts that should be pointed out: line chart, bar chart and candlestick chart.
Line chart is a series of data points which are connected by lines. It represents the dynamics of the closing price of the currency pair timeframe. Many traders consider the closing price to be the most important indicator of the trading day.
Bar chart - The trading range of the timeframe is displayed by vertical line, the lowest point of which displays the minimum price value within the timeframe, and the highest point - the maximum price value. The line to the left of the bar shows the opening price and the line to the right - the closing price.
Candlestick chart, the bar chart, also consists of four points: opening and closing prices form a rectangular body of the candle and the minimum price is displayed in vertical lines above and below the body of the candle. The candlestick chart is convenient for visual perception, as provides the function of coloring of the candle body.
Forex Chart Patterns Free
Forex chart patterns are a form of technical analysis, which are used to predict market trends and reversals. With the help of these Forex chart patterns it has become possible to predict whether the trend is going to continue its direction or is going to reverse back. There are two types of chart patterns: patterns of continuous and reversal trends.
Continuation patterns are formed during the pause of the current market trends, and these patterns are easy to recognize. If you look at the chart with a strongly marked trend you will see that sometimes prices are being corrected and go by trend again, forming certain formations. These formations are continuation patterns:
- Ascending Triangle
- Descending Triangle
- Symmetric Triangle
- Bullish Rectangle
- Rectangle (Bearish)
- Forex Flag
- Pennant
- Wedge
Reversal patterns represent geometric models on the charts which are formed when the price level reaches the maximum value of the trend. Recognition of these figures helps to define the end of the trend and the beginning of a new one. Reversal patterns include:
- Head and Shoulders
- Inverse Head and Shoulders
- Double Top
- Double Bottom
- Triple Top
- Triple Bottom
- Forex Diamond
There are many technical tools that help traders to predict the market movements and avoid possible losses. Proper interpretation of Forex chart trading strategy and efficient application of the technical analysis tools significantly increase the effectiveness of trading operations.
IFC Markets is a leading innovative financial company, offering private and corporate investors wide set of trading and analytical tools. The company provides its clients with Forex and CFD trading through its own-generated trading platform NetTradeX, which is available on PC, iOS, Android and Windows Mobile. The company also offers MetaTrader 4 and MetaTrader 5 platforms available on PC, Mac OS, iOS and Android. You may compare the advantages of each platform.
