After digesting data and announcements, investors thought long and concluded that we are close to the end of the rate hike cycle and read it as a positive sign to be happy. The question now is, how long can this optimism last?
Fed forecast for the terminal rate ending at 5.1% suggests just one more hike this year, which made investors happy. Nevertheless, the point is Fed made it clear that decisions will be based on the data they will get.
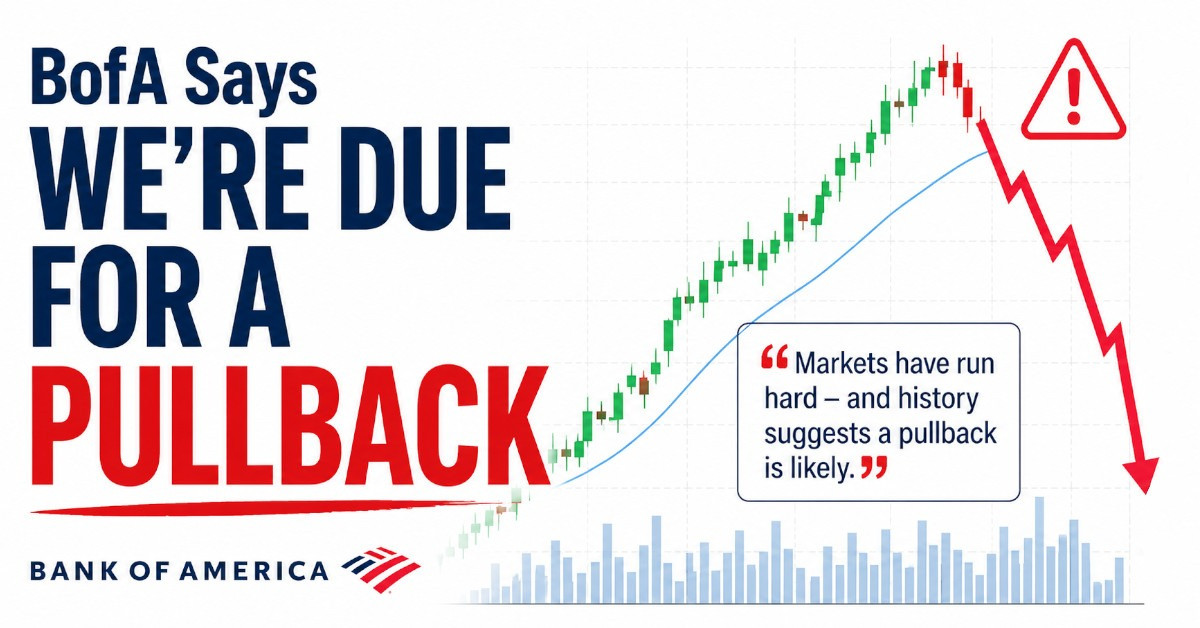
In addition, one of the reasons that may push the Fed to end the rate hike process sooner is the recent turmoil in the banking sector that could lead to a pullback in credit, which could also have economic effects. Remember that still, we are there, where the bad news is good news! Therefore, the reason is not a positive sign.
Dow fell more than 500 points on Wednesday; today, it regained all yesterday's loos! Rising rates are pressuring banks, primarily regional lenders. After the collapse of Silicon Valley Bank and Signature Bank earlier this month, more eyes and focus turned to this subject. If Fed slows and pauses the rate hike, another issue must be solved: inflation concerns! The need to fight inflation and maintain stability in the financial system in the current situation could be the biggest challenge for Fed in its history so far.
The challenge for Fed could get even more complicated when we look at the labor market data. According to the US Department of Labor, in the week ended March 17, initial jobless claims showed a still-strong labor market, falling to 191,000, much less than expectations for 197,000. It is the lowest application for unemployment benefits since the second week of April 2022. Fundamental data say we can not trust this return to rise further. However, we need more reason as well to go short!
From the technical point of view, a side movement between 32,500 and 35,000 with a mostly bearish tendency is more likely, incredibly, as long as the EMA crossing strategy has a bearish signal. RSI around 50 also confirms the weakness of bulls and bears!