
Welcome to the world of trading!
Every chart tells a story and every pattern can potentially unlock the door to profit.
Trading doesn't have to be a mystifying venture filled with confusion and uncertainty. We're here to break down this powerful candlestick pattern in a way that's easy to understand, and we'll show you how to use it to your advantage. If you are a beginner taking your first steps in the world of finance, we've got an interesting test with answers for.
So, grab your favorite beverage, settle into a comfortable chair, and get ready to explore the bullish engulfing pattern, learn how to spot it on your charts, and discover the keys to confirmation using technical indicators.
Question 1: What type of candlestick pattern is shown in the chart?
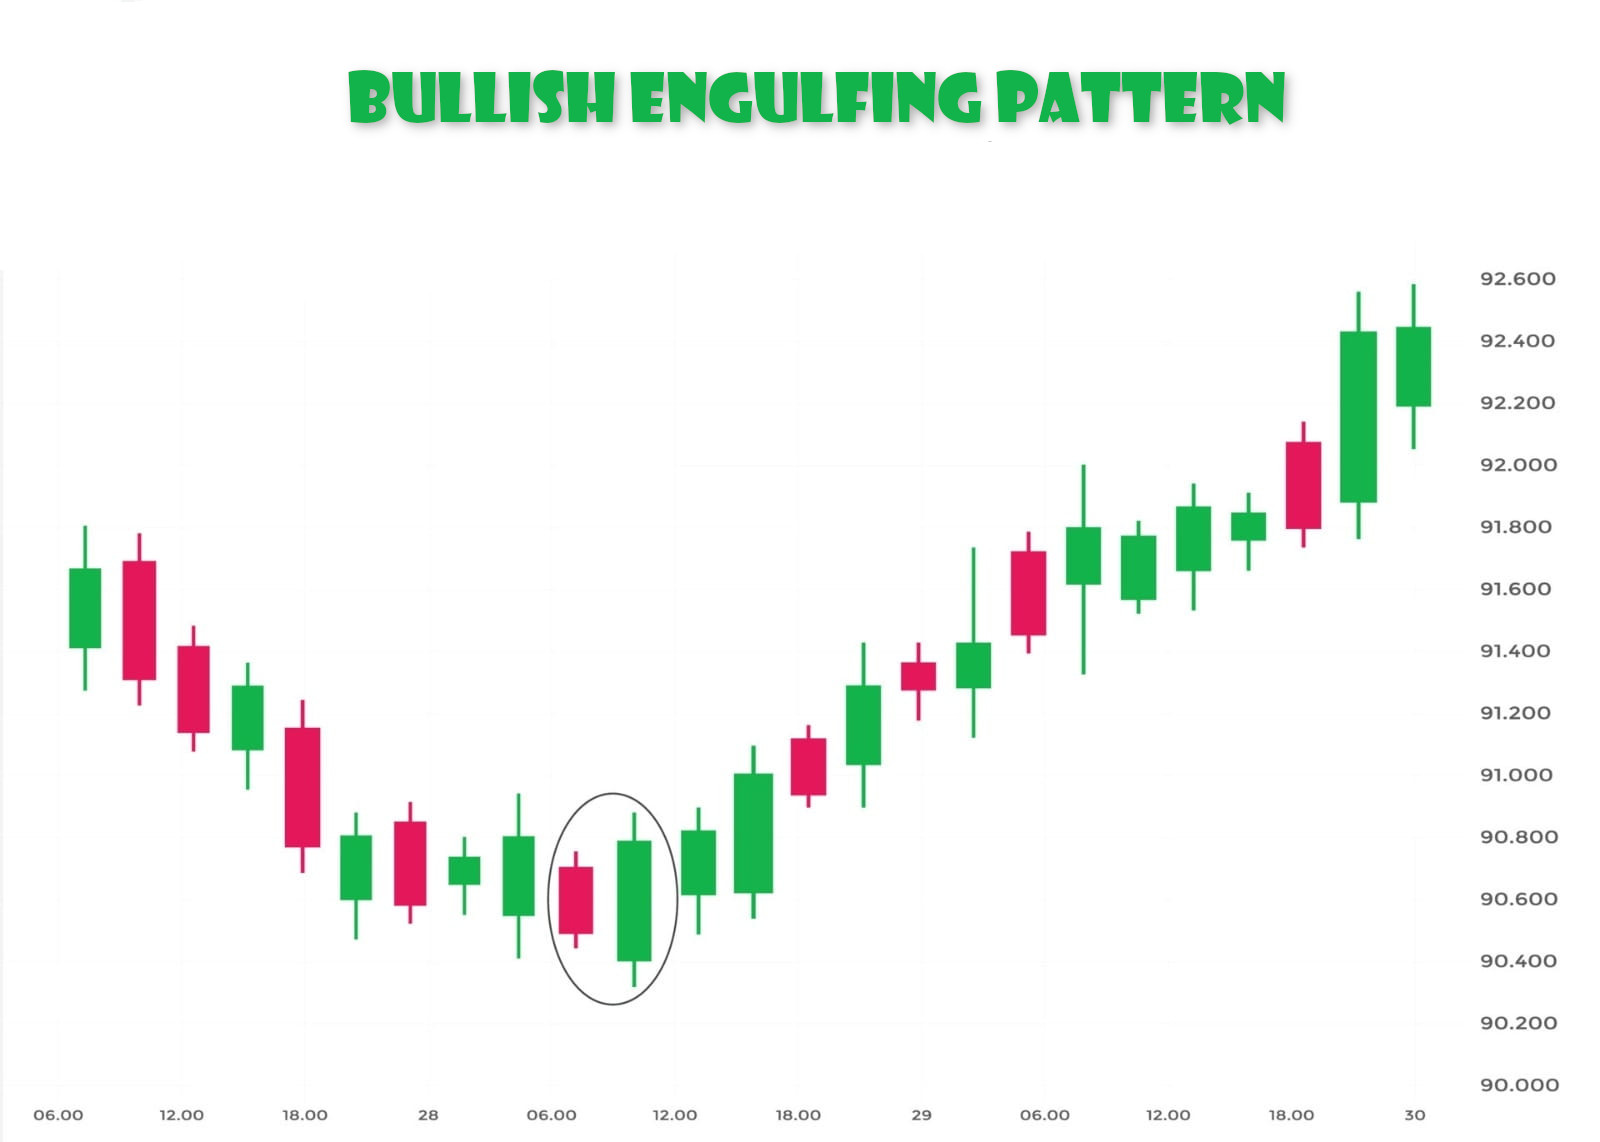
Answer: Bullish engulfing pattern
Question 2: What does a bullish engulfing pattern indicate?
Answer: A bullish engulfing pattern indicates that a bullish reversal is likely. It is formed when a bearish candle is completely engulfed by a bullish candle. This suggests that the bulls have gained control of the market and are likely to push prices higher.
Question 3: What would be a good entry point for a long trade based on this chart pattern?
Answer: A good entry point for a long trade based on this chart pattern would be above the high of the bullish candle that engulfed the bearish candle. This would ensure that the trader is entering the trade after the bulls have confirmed their control of the market.
Question 4: What would be a good stop-loss placement for this trade?
Answer: A good stop-loss placement for this trade would be below the low of the bearish candle that was engulfed. This would limit the trader's losses in case the bullish reversal fails.
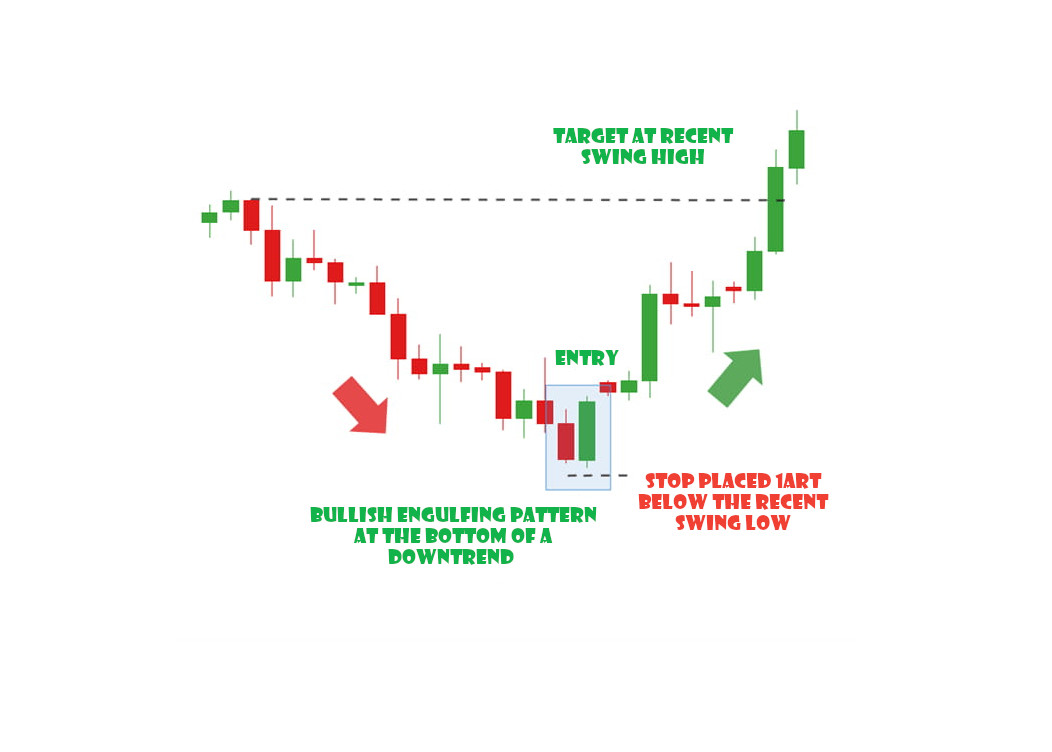
Question 5: What would be a good target for this trade?
Answer: A good target for this trade would be the next major resistance level, which is marked on the chart as a red horizontal line.
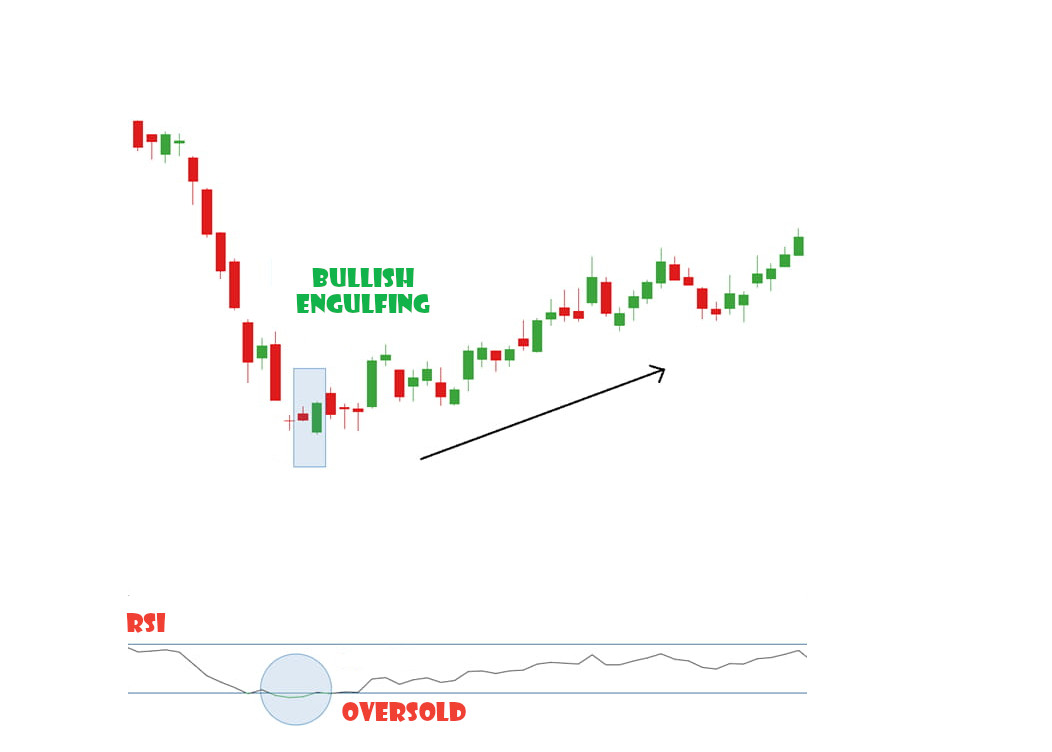
Bonus Question: What other technical indicators could be used to confirm the bullish reversal signal from the engulfing pattern?
Answer: Other technical indicators that could be used to confirm the bullish reversal signal from the engulfing pattern include:
- Moving averages: A bullish crossover of the 50-day and 200-day moving averages would be a strong confirmation of the bullish reversal.
- RSI: An RSI reading above 70 would indicate that the market is overbought and could be due for a pullback. However, if the RSI remains above 70 after the engulfing pattern, it would suggest that the bullish momentum is strong and the reversal is likely to continue.
- MACD: A bullish crossover of the MACD and signal lines would be another confirmation of the bullish reversal.
At the end I would like to add
The bullish engulfing pattern is a strong reversal signal that can be used to identify opportunities for profitable long trades. However, it is important to confirm the signal with other technical indicators before entering a trade.


Great information, thanks for sharing.