Market sentiment is positive.
Published data so far is positive. Despite missing the expectation of 800K, ADP numbers were much better than 565K of last month by showing 742K new positions. On the other hand, Markit composite and Service PMI, both more than expectations and above 60, confirming the excellent rebound in the service section after the latest improvements in Manufacturing numbers. And finally, ISM manufacturing PMI missed the expectation of 64.3; however, it is at the acceptable number of 62.7.
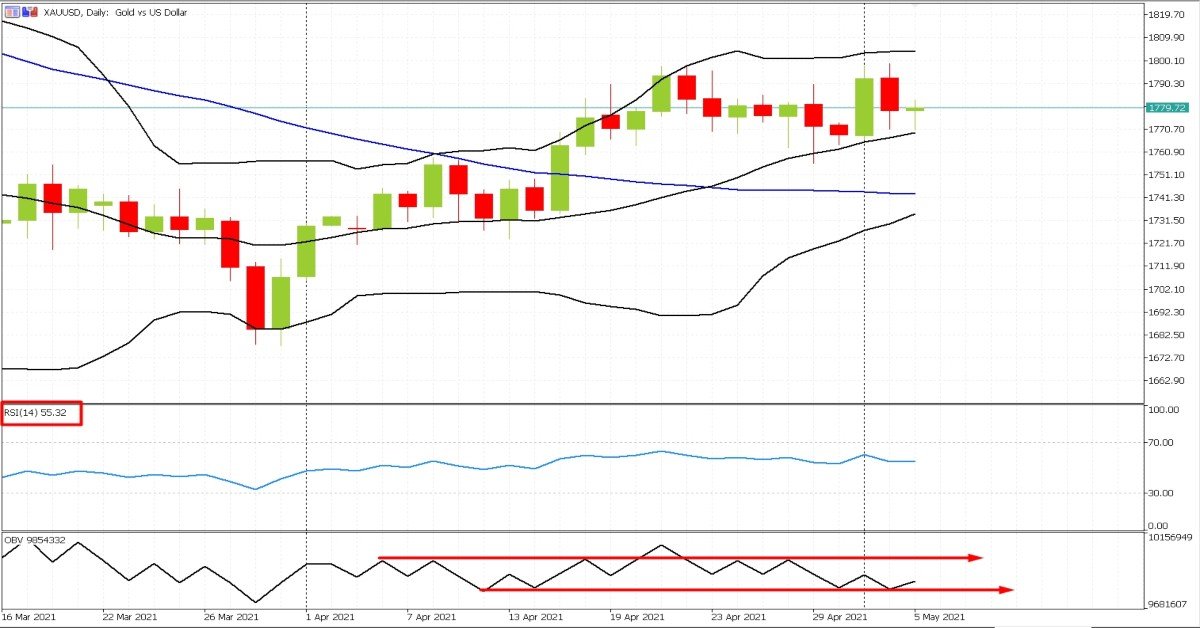
However, the market is such volatility, and thus fears and gears are confusing the Gold traders. This uncertain circumstance creates a side movement for Gold between the middle (1770) and the upper line of Bollinger Bands (1800).
Market volatile of last night, caused by US Treasury Secretary Janet Yellen's comments on inflation and rate hikes, was significant to the gold price. At the same time, the return of bond yields to 1.594% and the continued appreciation of the US dollar Index to 91.40 will be a factor to depress the gold price.
Looking at the technical indicators will give a better picture. RSI at 55 in the Daily chart says that the uptrend has not enough strength. OBV moves in a range, with descending tendency, while in the Bollinger Bands, price moves between the middle and upper line of it, signaling of ascending tendency. It is confirming the same mentioned confusion in the market. Therefore, we have to take care of significant levels and take action based on support and resistance levels.
The primary levels for Gold will be mention below.
Pivot point: 1,783
Resistance Levels: 1,795 / 1,811 / 1,822
Support Levels: 1,767 / 1,755 / 1,738


