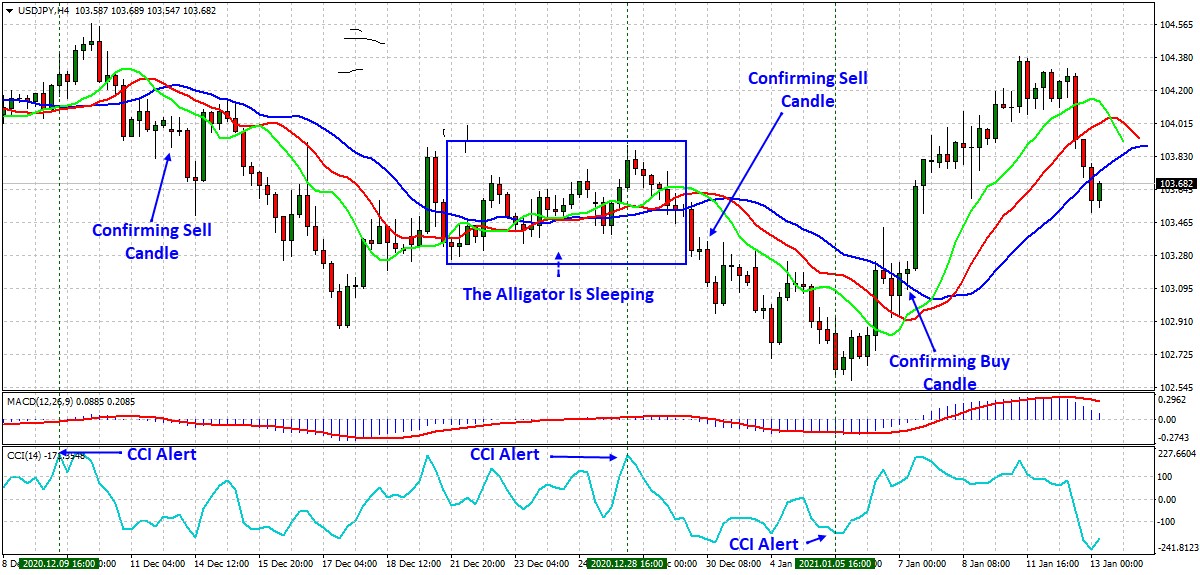
It must be remembered though that the Bill Williams Alligator is a lagging indicator. Lagging indicators follow the price action and are therefore known as trend-following indicators.
Therefore a better trading strategy can be designed by including a leading indicator which usually leads price movements. A suitable indicator is the CCI indicator (Commodity Channel Indicator).
Let us take the USDJPY pair and see what the chart analysis of the pair using the Williams Alligator and CCI will reveal as a viable

Alligator Indicator Settings
A simple Williams Alligator trading strategy could be:
- Anticipate your entry point when the “CCI” indicator is signaling an overbought condition (the second “CCI Alert”) and the Bill Williams 3 lines are entwined - the Williams Alligator is “sleeping” (the blue rectangle in the chart above);
- Execute a “Sell” order after the Green line breaches below the Red line, and a bearish Candle closes below them - confirming the downtrend is forming (second bearish candle after the blue rectangle in the chart above). Indication of emerging downward tilt of all Bill Williams 3 lines is further confirmation of downtrend formation;
- Exit the trade based on the profit target level you have chosen.
Similar steps can be executed in case of an uptrend formation:
- Anticipate your entry point when the “CCI” indicator is signaling an oversold condition (the third “CCI Alert”);
- Execute a “Buy” order after the Green line breaches above the Red line, and a bullish Candle closes above them - confirming the uptrend is forming. Indication of emerging upward tilt of all Bill Williams 3 lines is further confirmation of uptrend formation;
- Exit the trade based on the profit target level you have chosen.
It should be noted that Bill Williams Alligator will never be 100% correct as with any technical indicator, but the signals are consistent enough to augment the predictive power of technical analysis. Try demo-trading to develop your skills in interpreting and understanding Williams Alligator.


